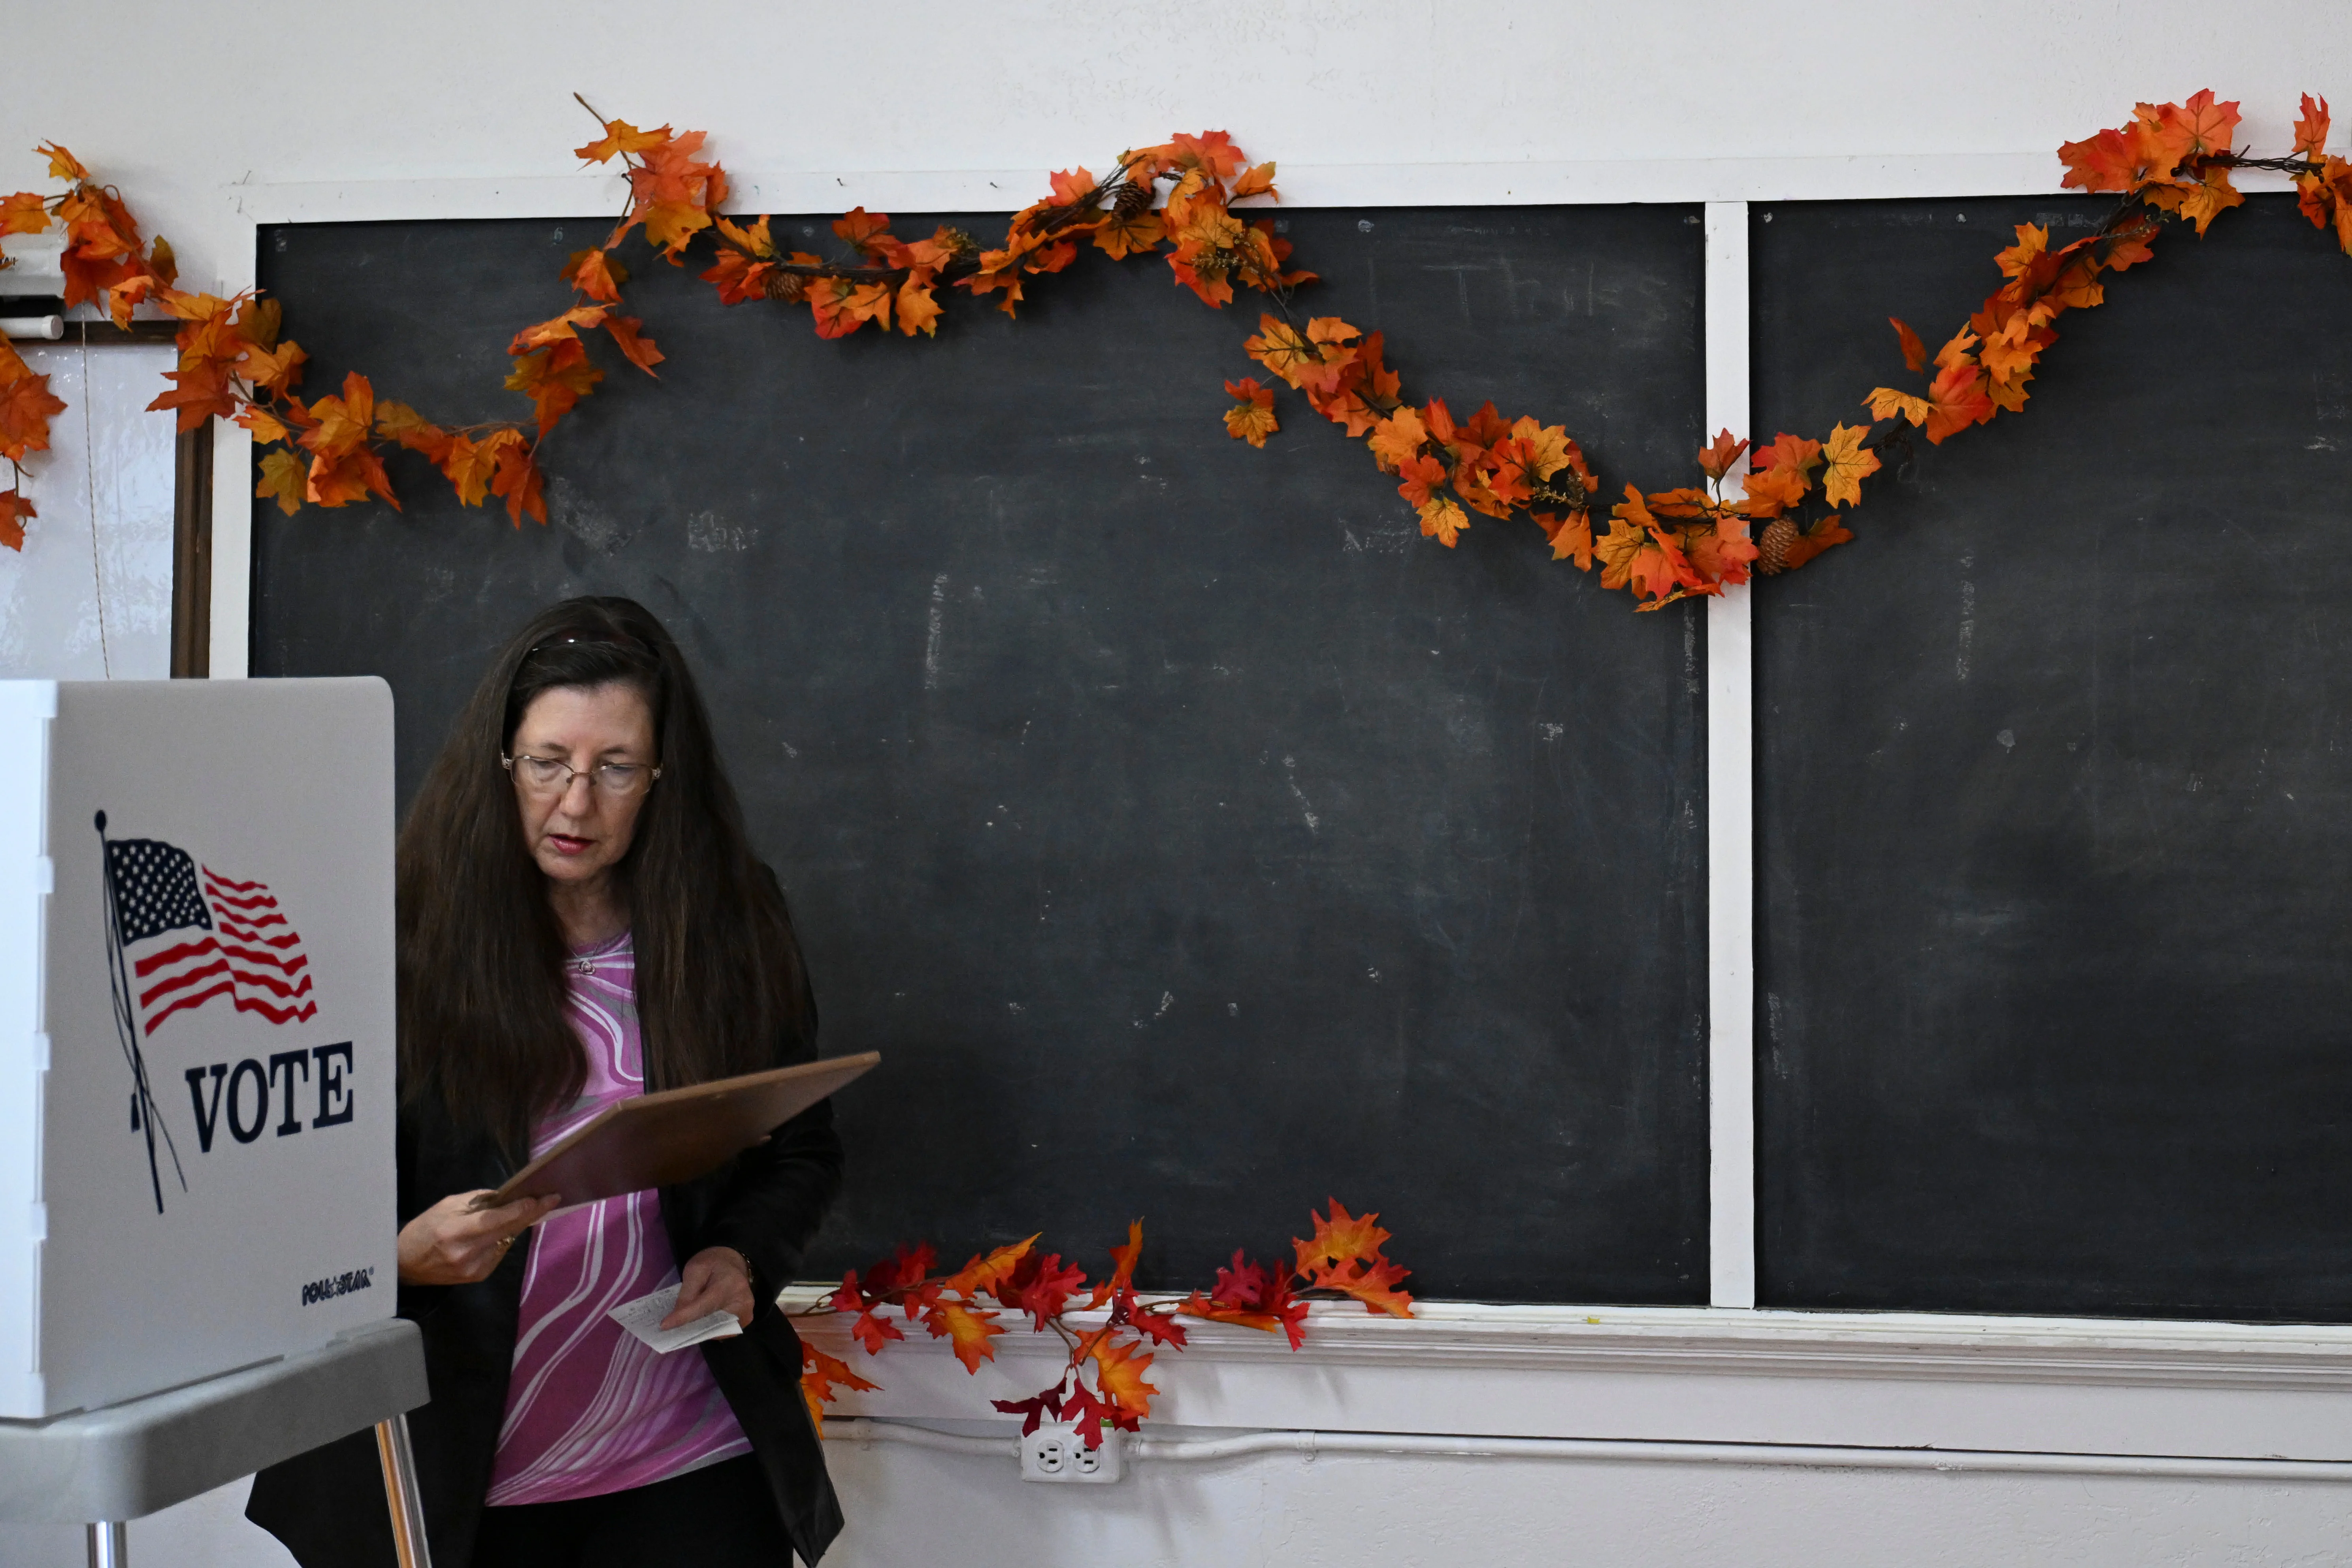
。周二,邦妮·福德在蒙大拿州德博尔吉亚的德博尔吉亚学校投票。汤米·马蒂诺/美联社下图显示了各个人口群体在中期选举中的投票情况。数据对应于表示他们投票给各党派众议院候选人的选民比例。
Here's how some key demographic groups voted in the midterms Bonnie Ford votes at the De Borgia School in De Borgia, Mont., on Tuesday. Tommy Martino/AP The charts below show how various demographic groups voted in the midterm elections The data corresponds to the share of voters who said they voted for a House candidate of each party.
数据来自对数万名选民的民意调查,由SSRS公司为包括美联社在内的多家新闻机构进行。完整样本的误差范围为正负0.6个百分点。投票新闻 2026年中期选举
The data comes from a poll of tens of thousands of voters, conducted by the firm SSRS for a number of news outlets, including the Associated Press. The full sample has a margin of error of plus or minus 0.6 percentage points. voting stories 2026 midterms