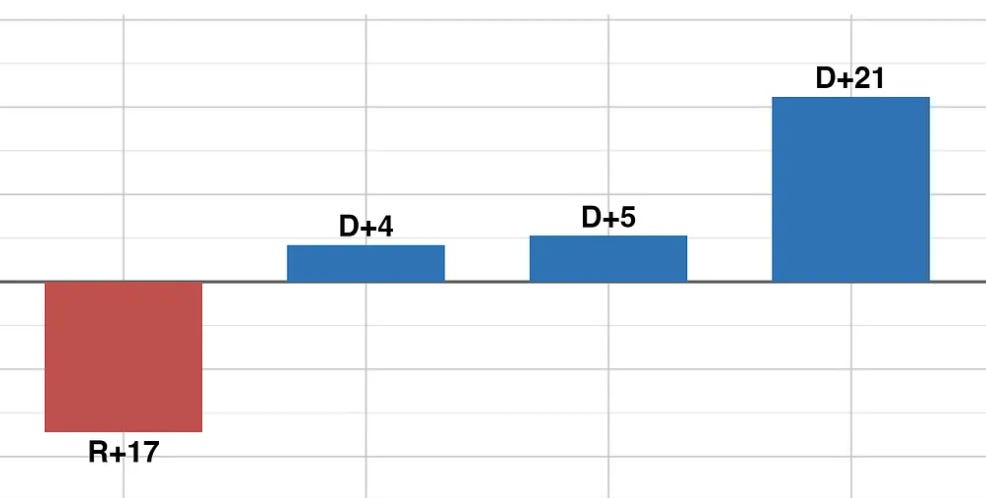
每两年一次的关于选举民调可能出现误差的担忧如今又甚嚣尘上。包括总统在内的共和党人近期频繁在新闻媒体及社交平台上发声,声称民调结果存在对他们不利的倾向。与此同时,正如我三周前所分析的那样,民调机构收集与调整样本数据的具体方式,实际上可能导致统计出的民主党支持率被低估——而似乎没多少人意识到这一问题。
The biennial freak-out over potential error in election polls is now in full force. Republicans, including the president, have gone on something of a news and social media spree recently to argue that the polls are biased against them. Meanwhile, as I showed three weeks ago, technical details about how pollsters are gathering and adjusting their samples might actually be creating polls that are understating Democratic support, a problem few seem ready for.
正如我在之前的文章中所提到的,虽然民调结果难免存在一定误差(这是民调机制本身的固有特性),但试图提前预测误差的方向其实毫无意义。
As I showed in this article and this one, while polls likely have some error in them (this is inherent to how polls work), it is a fool’s errand to try to predict the direction of error ahead of time.
不过,这并不意味着我们就没有办法去探究并解释民调结果为何可能出现偏差。Strength In Numbers在这方面做了不少精细的工作;毕竟如今民调机构调整数据的方式,其重要性已不亚于甚至超过了数据收集环节本身。
But that does not mean that we are without tools to explore and explain how our polls might be off. Strength In Numbers is doing some pretty sophisticated stuff on this front, since we know that how pollsters adjust their data is now as important as, or potentially more than, how they gather it.
在本周的深度分析中,我想向大家介绍一种我正在使用的新工具,它能帮助我们在11月大选前发现民调中潜在的偏差。
And in this week’s Deep Dive, I want to present one of the new tools I’m using to detect potential bias in the polls ahead of November’s elections.
其实,所有民调都面临一个由来已久的问题——不只是Strength In Numbers与Verasight合作的民调如此:愿意参与民调的人往往与不愿参与的人存在差异。1936年时,民调样本中高收入人群占比过高;2016年时,未接受过大学教育的白人群体接听电话的比例又偏低。
See, the age-old problem in polling — all polling, not just the Strength In Numbers/Verasight poll — is that the people who will take our polls are often different from those who won’t. In 1936, polls had too many high-income voters. In 2016, too few non-college-educated whites answered their phones.
这种现象被称为“无应答偏差”——即未应答者与应答者在特征上存在偏差。值得庆幸的是,民调机构可以通过加权调整的方式,让样本结构与人口普查数据相匹配,从而在很大程度上消除不同人群间的无应答偏差(当然,人口普查本身也是一项应答率极高的大型民调)。
This problem is called “non-response bias” — since the non-responders are biased compared to the responders. The good news is that pollsters can mostly weight away non-response for different demographic groups by forcing samples to match Census totals (the Census being, of course, a giant poll with a super high response rate!).
坏消息是,加权调整无法解决党派倾向导致的应答偏差——即某一党派的支持者选择不参与民意调查的比例明显高于另一党派,这种偏差是任何人口统计修正手段都难以消除的。之所以如此,是因为目前没有官方的全国性民主党与共和党人数统计数据可供加权参考,因此民调机构通常只有在选票统计完成后才会发现这一问题。
The bad news is that weighting can’t fix partisan non-response — supporters of one side quietly opting out of polls at a higher rate than the other, in a way no demographic correction can undo. That’s because there’s no official national tally of Democrats and Republicans to weight to, so pollsters usually find out they had a problem only after the votes are counted.
不过,如果我们能找到另一种指标来间接反映党派应答偏差,且该指标完全可以通过调查数据来测算,情况又会如何呢?这样一来就无需再依靠推测数据来调整本月的党派身份分布了!
But what if you could undo bias in a different metric that serves as a proxy for partisan non-response, and that you can detect entirely within the survey data? No more weighting to guesses at what the country’s party ID breakdown is this month!
举例来说,我们发现参与调查的人群往往在政治与社会事务上表现得极为活跃:他们的投票率更高、参与志愿服务的频率更高、向竞选活动捐款也更多,甚至去电影院看电影的次数也多于那些不参与调查的人。
We know, for example, that our freaky group of survey-takers tends to be super politically and socially engaged. They vote more, volunteer more, donate more to campaigns, and even see more movies in theaters than poll non-responders.
我们能否找出某些调查受访者比其他人更活跃的证据呢?如果确实如此,他们是否也更倾向于支持民主党或共和党呢?
Can we find a way to see if some of our poll respondents are more engaged than the rest? If they are, are they also more Democratic or Republican leaning?
这正是我在8月份开展的“Strength In Numbers”民调中所做的尝试。我设置了开放式文本问题,借此评估每位受访者的答题“投入程度”,进而对比高投入与低投入受访者的政治倾向。
That’s exactly what I did in our August Strength In Numbers poll. I ran an experiment with free-response text questions so I could grade each respondent’s “effort” in answering the poll. This let me compare high- and low-effort respondents and compare their politics.
换句话说,在假设民调结果过度反映了高活跃度人群的情况时,我们能否用调查中的“投入程度”指标来间接反映这种偏差呢?
In other words, in the hypothetical where polls are over-representing high-engagement individuals, can we proxy that with our in-survey measure of survey effort?
结果显示,高投入程度的受访者明显更倾向于支持某一党派。如果这一投入程度指标确实能预测那些未参与调查者(其投入程度可视为零)的投票倾向,那么今年11月的选举中,某一党派的得票优势可能比实际结果高出多达3.5个百分点。
It turns out that high-effort respondents are significantly more favorable to one party over the other. And if this measure of effort is at all predictive of the voting behavior of people who don’t answer the polls (who can be thought to have an effort of zero), the polls could be off in terms of vote margin by up to 3.5 points favoring one party this November.
你需要继续阅读才能弄清楚到底是哪一种情况。即将举行的中期选举将是对这一分析的一次“样本外”检验——该分析此前曾成功预测了近期选举中的民调误差,不过都是在选举结束之后才得以验证。
You’ll have to read on to figure out which one. The upcoming midterm elections will serve as an out-of-sample test of this analysis, which has predicted polling errors in recent elections, but only after the fact.