乌克兰对俄罗斯科技公司Yandex运营的数据中心发动无人机袭击后,网上开始流传称这些袭击扰乱甚至终止了俄罗斯宣传机器人活动的说法。这些账号常被指责在社交媒体上传播虚假信息或人为放大内容。
AfterUkrainian drone attacks on data centers operated by the Russian technology company Yandex, claims began circulating online that the strikes had disrupted or even halted the activity of Russian propaganda bots. These accounts are often accused of spreading disinformation or artificially amplifying content on social media.
在华沙安全论坛上,乌克兰总统弗拉基米尔·泽连斯基也暗示,对Yandex数据中心的袭击扰乱了机器人活动,称“由于机器人减少,仇恨减少、分裂减少、挑衅减少。”针对BBC Verify的询问,泽连斯基办公室表示,总统并非指机器人活动减少,而是“在谈论社交媒体上的氛围”。办公室补充称,他们看到“许多社交媒体用户报告称挑衅和仇恨评论减少”。
During the Warsaw Security Forum, Ukrainian President Volodymyr Zelenskyyalso suggestedthat the attacks on Yandex data centers had disrupted bot activity, saying"there was less hate, less division, and fewer provocations [because] there were fewer bots." In response to BBC Verify, Zelenskyy's office said that, rather than referring to reduced bot activity, the president was "talking about the atmosphere on social media." The office added that it had seen "reports of fewer provocative and hateful comments" from many social media users.
然而,目前尚无明确证据表明袭击与机器人活动下降有关。监测、分析与战略中心(CeMAS)总经理约瑟夫·霍尔恩伯格表示,目前“尚未发现可由Yandex数据中心袭击解释的俄罗斯虚假信息活动下降”。CeMAS系统性地监测此类行动。
So far, however, there is no clear evidence linking the attacks to a decline in bot activity. According to Josef Holnburger, managing director of the Center for Monitoring, Analysis and Strategy (CeMAS), there is currently "no decline in Russian disinformation activities that could be explained by the attack on Yandex data centers." CeMAS systematically monitors such campaigns.
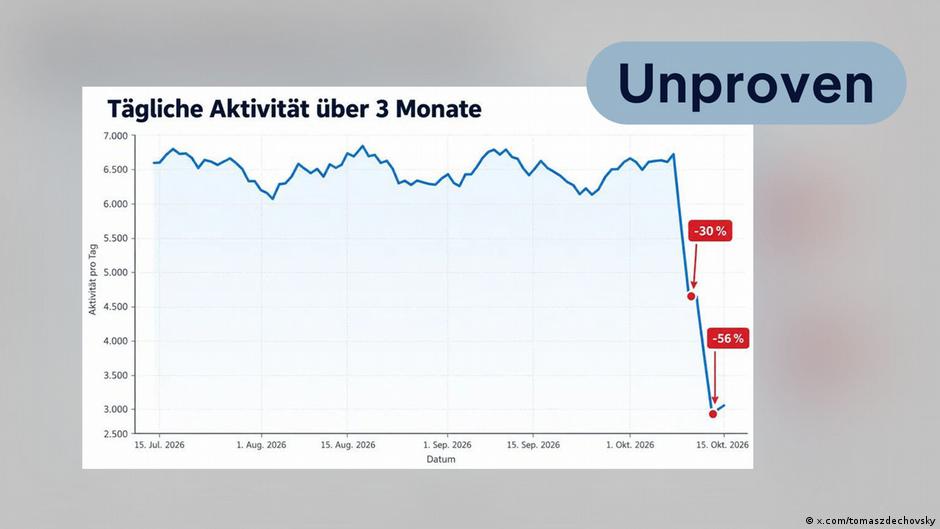
欧洲议员无证据分享图表 然而,一张误导性图表被当作所谓证据在网上流传。例如,捷克欧洲议会议员托马斯·泽赫沃夫斯基曾分享该图表。该帖子在X平台上被观看超过四百万次。他暗示该图表可能显示“围绕AfD的在线活动”下降,但未具体说明所指的活动类型。事实上,该图表很可能根本未显示任何内容。
European lawmaker shares graph without evidence on Nevertheless, a misleading graph has been circulated as supposed evidence. It was shared, for example, by Czech Member of the European Parliament Tomáš Zdechovský. His post was viewed more than four million times on X. He suggested that the graph might demonstrate a decline in "online activity around AfD," although he did not specify what kind of activity he meant. In reality, the graph most likely demonstrates nothing at all. A Czech Member of the European Parliament linked the graph to an alleged decline in online activity surrounding the AfD Image:
捷克欧洲议会议员将该图表与AfD周边在线活动 alleged 下降联系起来 图片:德语图表标题为“三个月的日常活动”。该图表似乎显示活动在10月初之前保持相对稳定,随后急剧下降,时间大致与对Yandex数据中心的袭击重合。然而,图表本身没有任何内容表明这与AfD相关的在线活动有关。
The German-language graph is titled "Daily activity over 3 months." It appears to show activity remaining relatively stable before dropping sharply in early October, roughly coinciding with the attacks on Yandex data centers. However, nothing in the graph itself indicates that this relates to AfD-related online activity.
无来源且比例错误 同样的问题也存在于图表所基于的数据。不清楚使用了哪些数据。未提供任何来源,也没有解释所谓“活动”的数据收集过程或计算方法,该活动最初在6,000到7,000之间波动,随后降至3,000以下。
No source and faulty scaling The same applies to the graph's underlying data. It is unclear which data were used. No source is provided, nor is there any explanation of the data collection process or calculation method for the alleged "activity," which initially ranges between 6,000 and 7,000 before falling below 3,000.
特别值得注意的是,该图表延伸至10月15日。其最后一个数据点似乎对应10月14日——而该图表首次在网上出现是在10月11日,当时10月14日仍是未来日期。未来日期的数据不可能存在。
Particularly striking is that the graph extends to October 15. Its final data point appears to correspond to October 14 –a date that was still in the future when the graph first appeared online on October 11. Data for a future date cannot exist.
该图表在X轴和Y轴上都存在比例错误。例如,在Y轴上,2,500和3,000之间的距离小于其他500单位的间隔。由于Y轴不从零开始,下降趋势在视觉上被放大了。在X轴上,相等的时间段被表示为不等的距离。
The graph also contains scaling errors on both the X and Y axes. For example, on the Y axis, the distance between 2,500 and 3,000 is smaller than the other 500-unit intervals. Because the Y axis does not begin at zero, the decline is visually exaggerated. On the X axis, equal periods of time are represented by unequal distances.
此外,尚不清楚分析了哪些平台,以及“活动”这一变量是如何计算的。缺乏已知数据来源、比例不准确以及包含“未来”值,这些因素强烈表明该图表并非基于事实数据和可靠统计方法所制作。
It is also unclear which platforms were analyzed and how the variable "activity" was calculated. The absence of a known data source, the inaccurate scaling, and the inclusion of "future" values strongly suggest that this is not a meaningful graph based on factual data and sound statistical methods.
AI参与无法证实,但有可能 目前尚不清楚是否使用了人工智能来制作该图表。鉴于存在的错误以及显然“幻觉”般地呈现了未来数据,不能排除人工智能的参与。
AI involvement cannot be proven, but is possible It is unclear whether AI was used to create the graph. Given the errors and the apparent "hallucination" of presenting future data, AI involvement cannot be ruled out.
误导性且充满错误的图表经常出现,其中一些可能是人工智能生成的。德国公共广播公司BR的#Faktenfuchs团队最近报道了一张此类图表,该图表错误地描绘了德国的工业产出(德文文章)。虚假或捏造的图表可能为无根据的主张增添可信度。该图表的创作者身份仍然未知。
Misleading and error-filled graphs, some of which may have been AI-generated, appear regularly. German public broadcaster BR's #Faktenfuchs team recently reported on one such graph that falsely depicted industrial production in Germany (article in German). False or fabricated graphs can lend credibility to unsupported claims. The identity of the graph's creator remains unknown.
Cloudflare数据实际上显示了什么?Cloudflare数据也经常被引用,用于支持机器人活动下降的说法。然而,根据CeMAS管理总监霍尔恩伯格的说法,人们对Cloudflare报告的实际含义存在误解。Cloudflare为许多网站提供服务,用于阻止被评估为非人类的流量。自动化网络流量很常见,例如,用于检查网站是否有新发布内容的爬虫。搜索引擎,包括Yandex,依赖这些爬虫。其他机器人可能被用于评论区的垃圾信息。
What do Cloudflare data actually show? Cloudflare data are also frequently cited in connection with claims of declining bot activity. However, according to CeMAS managing director Holnburger,there is a misunderstanding about what Cloudflare's report actually means. Cloudflare provides services to many websites that block traffic assessed as non-human. Automated web traffic is common and includes, for example, crawlers that check websites for freshly published content. Search engines, including Yandex, rely on these crawlers. Other bots may be used for spam in comment sections.
在给#Faktenfuchs的消息中,霍尔恩伯格写道:“网站上机器人活动的下降与社交机器人在社交网络上的不真实行为下降是完全不同的事情。”他提到Cloudflare数据时补充道:“从使用Cloudflare服务的服务器上的俄罗斯IP地址的整体活动来看,机器人活动并没有出现重大下降。”此外,没有理由假设与虚假信息相关的社交机器人所使用的基础设施会托管在Yandex的数据中心。“这些系统更可能分布在许多不同的提供商之间,”霍尔恩伯格写道。
In a message to #Faktenfuchs Holnburger writes, "a decline in bot activity on websites is something entirely different from a decline in inauthentic behavior by social bots on social networks." Referring to Cloudflare data, he added: "When looking at overall activity from Russian IP addresses on servers using Cloudflare services, there is no major decline in bot activity." Furthermore, there is no reason to assume that the infrastructure used by disinformation-related social bots would be hosted on Yandex data centers. "It is more likely that these systems are distributed across many different providers," Holnburger writes.
该文章最初用德语撰写,由Alima de Graaf改编为英语 ## 乌克兰袭击“俄罗斯的谷歌”。影响如何?
The article was originally written in German and adapted into English by Alima de Graaf ## Ukraine attacks 'Russia's Google.' What was the impact?