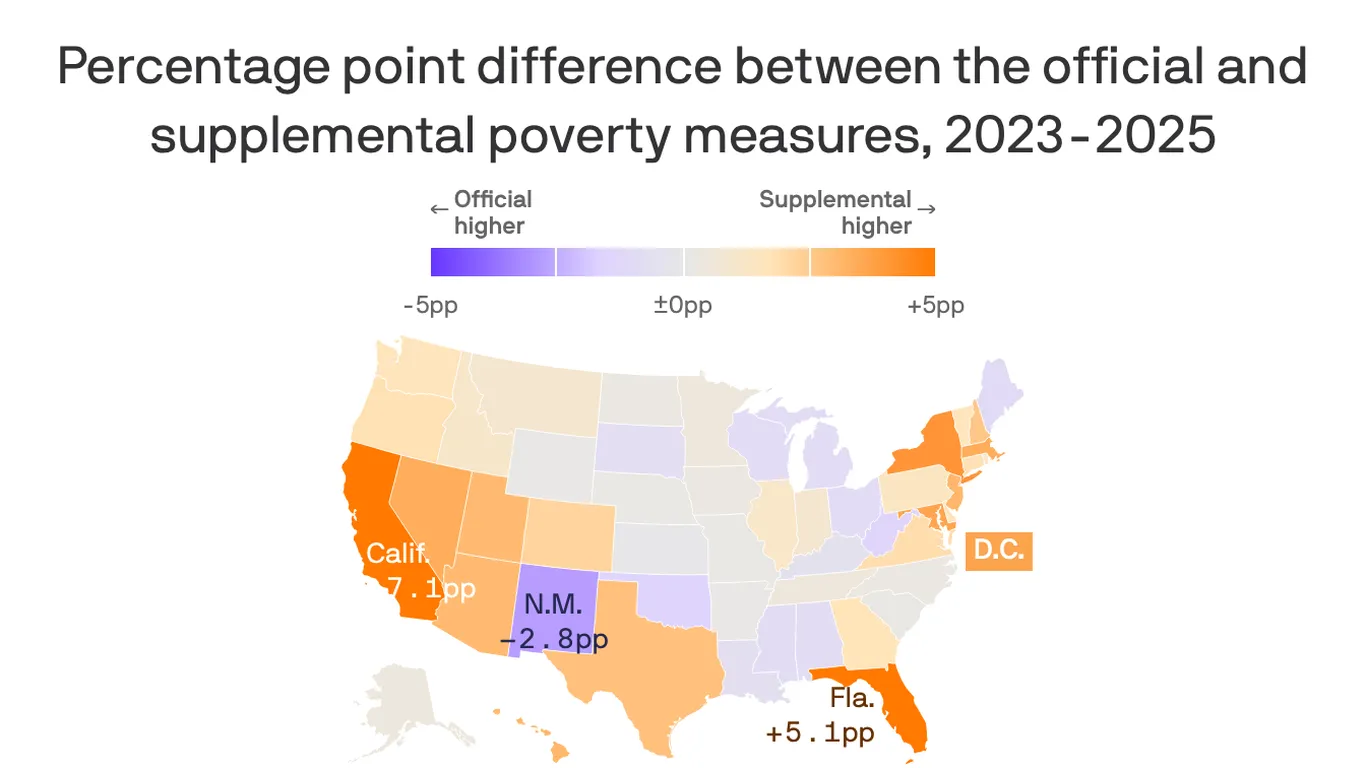
美国人口普查局地图:Erin Davis/Axios 加利福尼亚州和路易斯安那州有着令人惊讶的共同点:根据人口普查局的数据,当生活成本被纳入考量时,这两个州的贫困率均位居全国前列。
U.S. Census Map: Erin Davis/Axios California and Louisiana have something surprising in common: Both have among the nation's highest poverty rates when the cost of living is factored in, according to Census Bureau data.
为什么这很重要:南部各州长期主导着美国传统的贫困排名。但当更多家庭的财务状况被纳入考量时,这种熟悉的地域分隔开始消失。
Why it matters: Southern states dominate America's traditional poverty rankings. But that familiar geographic divide starts to disappear when more of a family's financial realities are taken into account.
- Axios 分析了人口普查局2023至2025年的各州贫困率估计数据,以观察当住房、税收、医疗费用和政府福利被纳入图景时会发生什么。
• Axios analyzed 2023-2025 state poverty estimates from the Census Bureau to see what happens when housing, taxes, medical expenses and government benefits enter the picture.
我们发现的情况:根据人口普查局传统式的官方衡量标准,路易斯安那州的贫困率为19.6%,加利福尼亚州为10.7%。新罕布什尔州最低,为5.4%。
What we found: Under the Census' traditional-style official measure, Louisiana had a 19.6% poverty rate and California was at 10.7%. New Hampshire was the lowest at 5.4%.
- 南部地区拥有传统贫困率显著高于全国平均水平的11个州中的10个。
• The South is home to 10 of the 11 states where the traditional poverty rate significantly outpaced the national average.
- 在更广泛的补充贫困衡量标准(SPM)下,加利福尼亚州的贫困率几乎增加了三分之二,达到17.8%;路易斯安那州仍保持在接近最高水平的19%。
• California's poverty rate jumped by nearly two-thirds to 17.8% under the broader Supplemental Poverty Measure, or SPM. Louisiana remained near the top at 19%.
- 缅因州的SPM贫困率全国最低,为6.4%,其次是内布拉斯加州的7.5%和明尼苏达州的7.9%。
• Maine posted the nation's lowest SPM rate at 6.4%, followed by Nebraska at 7.5% and Minnesota at 7.9%. How it works:
它是如何运作的:传统衡量标准将税前现金收入与不随地理变化的家庭规模门槛进行比较。
The traditional measure compares pretax cash income with a family-size threshold that doesn't change by geography.
- SPM 将 SNAP 和住房援助等福利纳入考量,考虑税收和税收抵免,扣除工作和医疗费用,并根据住房成本的地区差异进行调整。
• The SPM adds benefits such as SNAP and housing assistance, factors in taxes and tax credits, subtracts work and medical expenses, and adjusts for geographic differences in housing costs. Zoom out:
全局视角:官方贫困率连续第三年下降至10.2%,而儿童贫困率降至历史最低的13.4%。
The official poverty rate fell for a third straight year to 10.2%, while child poverty reached a record-low 13.4%.
- 然而,SPM 在统计上基本未变,仍为13.1% — — 比官方贫困率高出近三个百分点。
• Yet the SPM remained statistically unchanged at 13.1% — nearly three percentage points above the official rate.
- 2025年,实际中位数家庭收入达到历史最高的87,460美元。
• Real median household income hit a record $87,460 in 2025. Yes, but:
但需要注意的是: SPM 不会取代官方贫困率。
The SPM doesn't replace the official poverty rate.
- 人口普查局将其设计为另一种视角 — — 一种能够捕捉传统衡量标准所遗漏的资源和不可避免支出的视角。
• Census designed it as another lens — one that captures resources and unavoidable expenses the traditional measure misses.
- 州级数据也不是2025年的单年估计。人口普查局建议使用三年平均值,因为目前人口调查中的州级样本较小。
• The state figures also aren't single-year 2025 estimates. Census recommends three-year averages because state samples in the Current Population Survey are smaller.
结论:仅凭收入无法判断一个家庭是否能够收支平衡。
The bottom line: Income alone doesn't tell you whether a family can make ends meet.