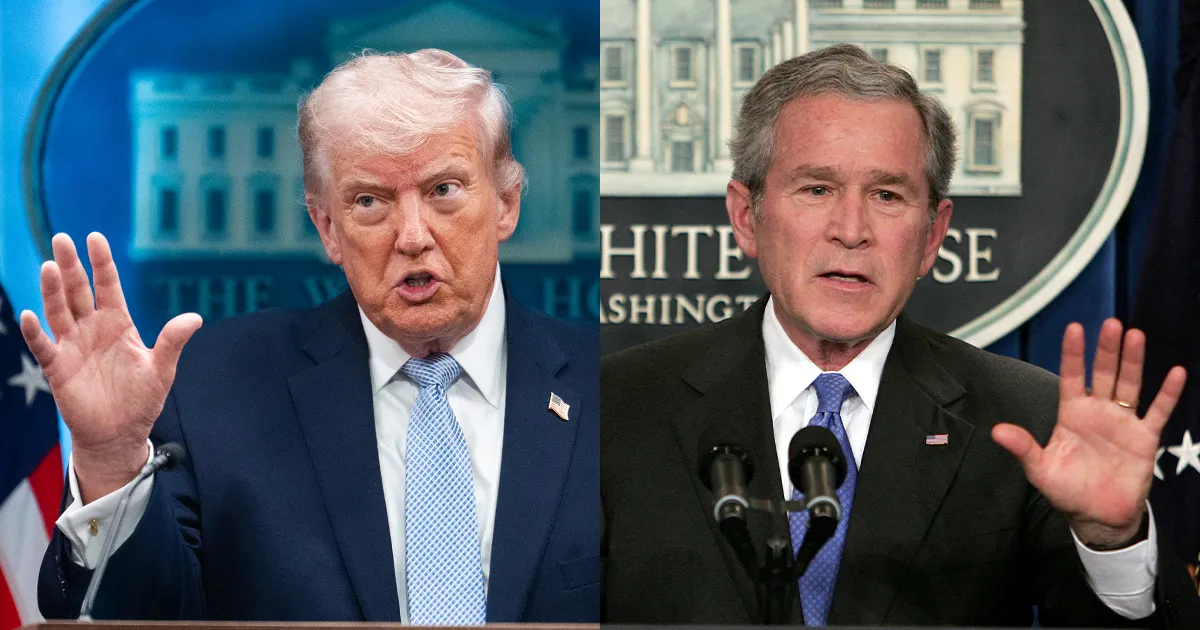
距离选举日仅剩不到一个月,史蒂夫·拉特纳分析了今年中期选举与2006年中期选举之间的“显著相似之处”。
With less than a month until Election Day , Steve Rattner broke down the “striking similarities” between this year’s midterm elections and the 2006 elections.
当年,选民们同样面临着战争、物价上涨以及极不受欢迎的总统这一组合局面,这一局面最终对时任总统及其所属政党造成了毁灭性打击。然而,正如这位《晨间乔》节目经济分析师所展示的数据所示,唐纳德·特朗普总统此次参选时的处境可能比20年前的乔治·W·布什总统还要糟糕。
Back then, voters faced a similar mix of war, rising costs and a deeply unpopular president — a combination that proved disastrous for the incumbent president and his party. But as the “Morning Joe” economic analyst’s numbers showed, President Donald Trump may be entering this election in an even weaker position than former President George W. Bush was in two decades ago.
拉特纳首先谈到了汽油价格。这位前财政部官员指出,布什在2006年中期选举前面临着艰难局面。
Rattner began with gas prices. The former Treasury official said Bush had a “tough run” heading into the 2006 midterms.
“当时他正经历战争;卡特里娜飓风也导致汽油价格进一步上涨。因此,在其第二任期的绝大部分时间里,汽油价格都高于特朗普执政时期的水平,”他说道。
“He had a war; he had Hurricane Katrina, which also added to gas prices; and so, for most of his second term up to this point, gas prices were higher than they have been for Trump,” he said.
不过到了选举日当天,布什执政时期的汽油价格出现了大幅下跌。经通货膨胀因素调整后,2006年美国民众购买汽油的平均价格为每加仑3.69美元,而如今这一数值为4.35美元。拉特纳指出,这一差距意味着特朗普政府所面临的汽油价格形势比2006年时更为严峻。
But by Election Day, gas prices under Bush had fallen sharply. Adjusted for inflation, Americans paid an average of $3.69 per gallon in 2006, compared with $4.35 today, a gap Rattner said means the Trump administration is “facing a worse gas price situation than they were in 2006.”Gas prices fell 25% in the three months before the 2006 midterms.
2006年中期选举前的三个月里,汽油价格下降了25%。而此次选举前夕,汽油价格却持续上涨:目前为每加仑4.46美元,远高于1月份的2.88美元。
They’re rising heading into this round: $4.46 a gallon, up from $2.88 in January. My @Morning_Joe Chart pic.twitter.com/TWyr6PXvYV
据拉特纳称,薪资状况同样不容乐观。布什执政初期实际薪资增长乏力,但随着通货膨胀率回落,劳动者的购买力有所提升。拉特纳提供的图表显示,到选举日时实际薪资的年增长率达到了2.2%。相比之下,特朗普执政期间实际薪资增长几乎停滞。
— Steve Rattner (@SteveRattner) October 8, 2026 The wage picture is similarly bleak, according to Rattner. Bush initially faced weak real-wage growth, but as inflation eased, workers’ purchasing power improved. Rattner’s charts showed real wages rising at an annual rate of 2.2% by Election Day. Under Trump, by contrast, real-wage growth has essentially flatlined.
“选民们会发现,在特朗普任内实际薪资几乎没有增长,”他说道。
“Voters are looking at no real wage increases under Trump,” he said. Real wage growth is stagnant over the past year.
过去一年里实际薪资增长一直处于停滞状态。而在2006年,到选举日时实际薪资的年增长率已达2.5%。
In 2006, it was rising 2.5% annually by election day. My @Morning_Joe Chart pic.twitter.com/OqrNcEXdT3 — Steve Rattner (@SteveRattner)
拉特纳还分析了其他几项能够反映选民对经济前景看法的指标,包括通货膨胀率、失业率、新增就业岗位数量、经济增长率以及房贷利率。虽然特朗普执政期间的失业率和经济增长率与布什时期相当,但在其他关键指标上却逊色于前任。
October 8, 2026 Rattner also examined several other indicators that shape voters’ economic outlook, including inflation , unemployment , job creation , economic growth and mortgage rates . While Trump’s unemployment rate and economic growth were comparable to Bush’s, he has lagged behind his predecessor on the other key measures. Inflation, mortgage rates, and hiring are all worse today than in October 2006. Only unemployment and economic growth are roughly the same. My
目前的通货膨胀率、房贷利率以及就业形势都比2006年10月时更为糟糕,只有失业率和经济增长率大致维持原状。
@Morning_Joe Chart pic.twitter.com/lgS8x6yhpO
“总体来看,与布什执政时期相比,选民们如今看到的特朗普治下的经济形势要严峻得多,”拉特纳说道。
— Steve Rattner (@SteveRattner) October 8, 2026 “On balance, voters are looking at a much tougher economic picture under Trump than they were under Bush,” Rattner said.
支持率数据或许是最能说明问题的对比指标。目前特朗普的支持率为37%,这一数值与2006年中期选举前夕布什的支持率几乎一致。不过布什当年年初的支持率曾超过50%,只是随后战争及卡特里娜飓风的影响才使其支持率逐步下滑。而特朗普自重返白宫以来,支持率始终未能突破50%。
The approval numbers may be the most revealing comparison. Trump’s approval rating stands at 37%, which is nearly identical to Bush’s heading into the 2006 midterms. But Bush began that year with approval above 50%, before the war and Hurricane Katrina steadily dragged his numbers down. Trump, meanwhile, has not reached 50% approval since returning to the White House. Trump’s approval rating is 37%, almost exactly where Bush was before the 2006 midterms, which his party lost badly. My @Morning_Joe Chart pic.twitter.com/3hMWTK1AZB — Steve Rattner (@SteveRattner)
2006年,布什所在的政党在选举中遭遇重创,不仅失去了众议院控制权,还丢掉了参议院多数席位,当时的布什将这一结果形容为“惨败”。如今20年过去了,拉特纳的分析数据表明,特朗普或许正要求共和党人去应对一个更为艰难的现实局面。
October 8, 2026 Bush’s party was punished at the ballot box in 2006, losing control of both the House and the Senate in what the then-president described as a “thumping.”And now, 20 years later, Rattner’s numbers suggest Trump may be asking Republicans to defend an even more difficult reality
“如今的情况与2006年有诸多相似之处,而这些相似之处大多对特朗普不利,”他说道。您可点击页面顶部的视频链接观看拉特纳的完整分析。
“There are so many similarities between now and 2006,” he said, “most of which don’t work in Trump’s favor.”You can watch Rattner’s full analysis in the clip at the top of the page.
这篇题为《四张图表揭示为何特朗普领导的共和党可能面临比2006年布什时期更糟糕的中期选举结果》的文章最初发表于。
The post 4 charts show why Trump’s GOP may face a worse midterm fate than Bush’s 2006 ‘thumping’ appeared first on .