始于9月的法国抗议活动已蔓延至11个以上欧洲国家,民众对高昂房租、燃油价格上涨以及公共服务削减的愤怒情绪不断升温。
that began in September in France have spread to more than 11 European countries as anger rises over high rents and fuel prices and cuts to public services.
许多年轻抗议者表示,他们不再指望能比父辈过得更好,家庭财富数据显示代际之间存在巨大鸿沟。
Many young protesters said they no longer expect to be better off than their parents, and household wealth data show a wide gap between generations.
根据欧洲央行(ECB)2023年家庭财务与消费调查,在欧元区及另外两个欧洲国家,户主年龄在35岁以下的家庭净财富中位数约为2.5万欧元(约合27870美元),而户主年龄在55至64岁的家庭净财富约为20.8万欧元(约合231882美元),是前者的8倍多。
Across the eurozone and two other European countries, households headed by someone under 35 have a median net wealth of about 25,000 euros ($27,870) while those headed by 55- to 64-year-olds are worth about 208,000 euros ($231,882), more than eight times as much, according to the European Central Bank’s (ECB’s) 2023 Household Finance and Consumption Survey.
在本期图解报道中,半岛电视台对比了22个欧洲国家不同年龄段的财富状况,并审视自2000年以来生活成本上涨了多少。财富差距在哪里最大?
In this visual explainer, Al Jazeera compares wealth by age groups across 22 European countries and looks at how much more expensive life has become since 2000. Where is the wealth gap widest?
自2010年起,由欧洲央行和各国央行共同开展的家庭财务与消费调查,追踪欧元区、捷克共和国和匈牙利的家庭财富与债务情况。
The Household Finance and Consumption Survey, run by the ECB and national central banks since 2010, tracks household wealth and debt in the eurozone, the Czech Republic and Hungary.
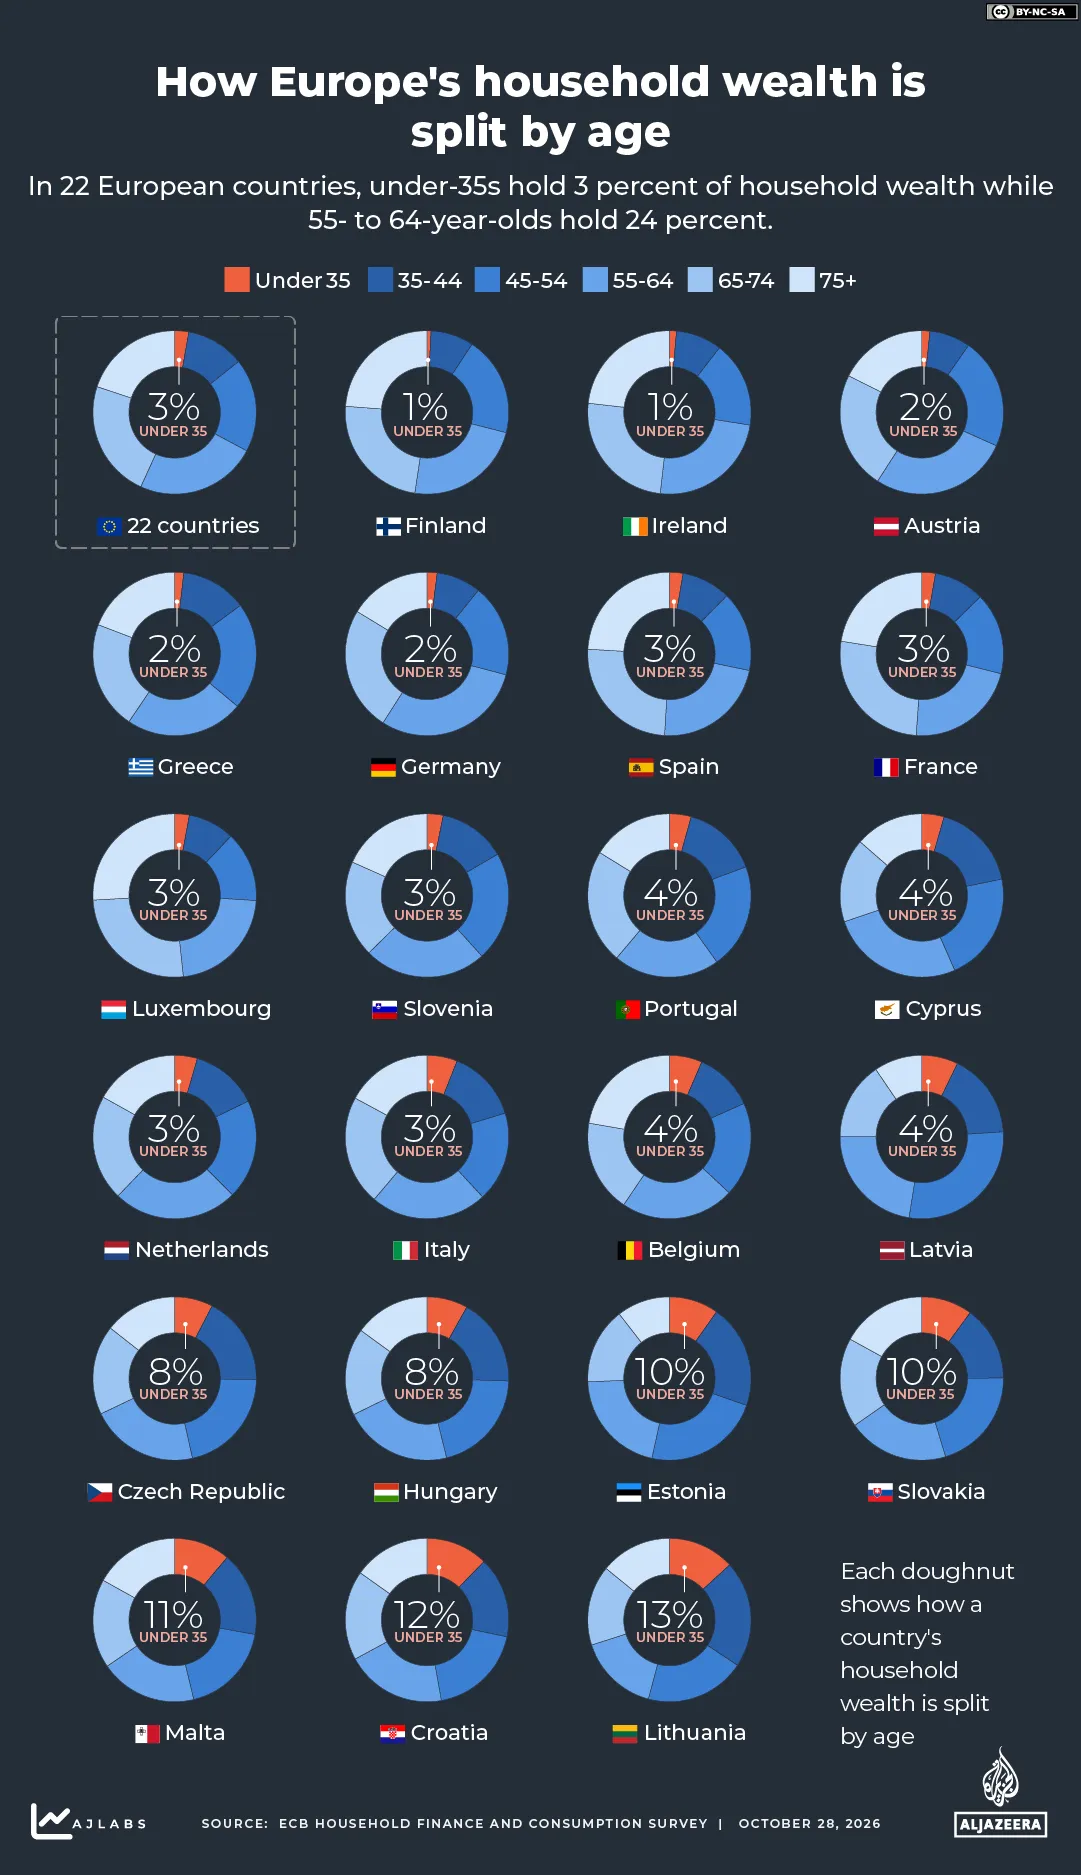
该调查衡量的是净财富,包括房产、汽车、贵重物品和储蓄,减去债务。在受访的22个国家中,35岁以下群体仅占家庭总财富的2.8%,而55至64岁群体占据最大份额,达24%。
It measures net wealth, which includes property, cars, valuables and savings, minus debts. Under-35s hold just 2.8 percent of all household wealth in the 22 countries while 55- to 64-year-olds hold the largest share at 24 percent.
在芬兰,35岁以下群体仅占家庭财富的0.8%,为受访国家中最低;55岁以上群体则占据71%以上。年轻群体的份额在爱尔兰(1.4%)、奥地利(1.6%)、希腊(1.8%)和德国(2%)也同样很低。
In Finland, under-35s hold 0.8 percent of household wealth, the lowest share of any country surveyed, while over-55s hold more than 71 percent. Young people’s shares are also small in Ireland (1.4 percent), Austria (1.6 percent), Greece (1.8 percent) and Germany (2 percent).
不断上涨的住房成本意味着许多年轻人无法负担父辈或祖辈能够负担的东西。
Rising housing costs mean many young people cannot afford what their parents or grandparents could.
在中东欧国家,财富分配相对均衡。在立陶宛,35岁以下群体占13.2%,而55至64岁群体占15.9%。克罗地亚为12.3%,斯洛伐克为10.1%,爱沙尼亚为9.8%。马耳他以11.1%成为这两个地区之外的例外。
Wealth is more evenly spread in Central and Eastern Europe. In Lithuania, under-35s hold 13.2 percent, against 15.9 percent for 55- to 64-year-olds. Their share is 12.3 percent in Croatia, 10.1 percent in Slovakia and 9.8 percent in Estonia. Malta, at 11.1 percent, is the exception outside the two regions.
下图显示,在受访的每个国家中,家庭财富在各年龄段之间是如何分配的。
The graphic below shows how household wealth is split between age groups in each country surveyed.
“我们看到的实际上是住房价格非常大幅度地上涨,无论是租赁市场还是自有住房市场,”欧洲社会观察站的伊夫林·阿斯托尔对半岛电视台《成本核算》节目表示。
“What we’ve seen is actually a very strong increase in housing prices both in terms of the rental market as well as the ownership market,” Evelyn Astor of the European Social Observatory told Al Jazeera’s Counting the Cost programme.
“所有这些也在强化一种不平等感,因为归根结底,普通家庭难以支付房租或购买住房,而拥有资本的富人却能在欧洲住房市场进行相当大规模的投资,”她说。比2000年贵多少?
“All of this is also reinforcing a sense of inequality because ultimately ordinary families are struggling to pay their rents or be able to purchase their homes whereas wealthy people with capital are able to make rather significant investments in the European housing market,” she said. How much more expensive is it than 2000?
根据欧盟统计局的数据,自2000年以来,食品、能源、交通和家庭账单等日常商品和服务的价格在欧元区、匈牙利和捷克共和国上涨了67.2%。
Prices of everyday goods and services, such as food, energy, transport and household bills, have risen by 67.2 percent in the eurozone, Hungary and the Czech Republic since 2000.
在我们图表所列国家中,匈牙利的涨幅最陡峭,价格翻了两倍多。其协调消费者价格指数是欧盟衡量日常商品和服务成本的官方指标。
Of the countries in our chart, Hungary has seen the steepest rise with prices more than tripling, according to Eurostat, the European Union’s statistics agency. Its harmonised index of consumer prices is the EU’s official measure of how much everyday goods and services cost.
下图显示,以2000年价格在指数中设为100为基准,各国消费价格自2000年以来发生了怎样的变化。
The chart below shows how consumer prices have changed in each country since 2000 with prices in 2000 set at 100 on the index.
东欧国家涨幅最剧烈——尤其是2022年俄罗斯全面入侵乌克兰开始后——因为这些国家严重依赖俄罗斯能源供应。
Eastern European countries have seen the sharpest increases – particularly since 2022 when Russia’s full-scale invasion of Ukraine began – because many relied heavily on Russian energy supplies.
直到2022年,价格平均每年上涨约2%,当时欧盟年通胀率触及9.2%。
Prices rose by about 2 percent a year on average until 2022 when annual inflation in the EU hit 9.2 percent.
这一飙升主要由能源成本推动。此后通胀有所缓和,但新冠疫情和乌克兰战争带来的价格上涨并未逆转。
The surge was driven mainly by energy costs. Inflation has since eased, but the price rises of the COVID-19 pandemic and the war in Ukraine have not reversed.